Synthisophy
Skinwalkers - Chapter 18
The following are direct quotes from the book Tribe, On Homecoming and Belonging, by Sebastian Junger, May 2016, except for statements in italic added.
The ultimate act of disaffiliation isn’t littering or fraud, of course, but violence against your own people. When the Navajo Nation—the Diné, in their language—were rounded up and confined to a reservation in the 1860s, a terrifying phenomenon became more prominent in their culture. The warrior skills that had protected the Diné for thousands of years were no longer relevant in this dismal new era, and people worried that those same skills would now be turned inward, against society. That strengthened their belief in what were known as skinwalkers, or yee naaldlooshii.
Skinwalkers were almost always male and wore the pelt of a sacred animal so that they could subvert that animal’s powers to kill people in the community. They could travel impossibly fast across the desert and their eyes glowed like coals and they could supposedly paralyze you with a single look. They were thought to attack remote homesteads at night and kill people and sometimes eat their bodies. People were still scared of skinwalkers when I lived on the Navajo Reservation in 1983, and frankly, by the time I left, I was too.
Virtually every culture in the world has its version of the skinwalker myth. In Europe, for example, they are called werewolves (literally “man-wolf” in Old English). The myth addresses a fundamental fear in human society: that you can defend against external enemies but still remain vulnerable to one lone madman in your midst. Anglo-American culture doesn’t recognize the skinwalker threat but has its own version. Starting in the early 1980s, the frequency of rampage shootings in the United States began to rise more and more rapidly until it doubled around 2006. Rampages are usually defined as attacks where people are randomly targeted and four or more are killed in one place, usually shot to death by a lone gunman. As such, those crimes conform almost exactly to the kind of threat that the Navajo seemed most to fear on the reservation: murder and mayhem committed by an individual who has rejected all social bonds and attacks people at their most vulnerable and unprepared. For modern society, that would mean not in their log hogans but in movie theaters, schools, shopping malls, places of worship, or simply walking down the street.
Here is a list of skinwalkers, and their shooting rampages in the USA over the last 30 years. Note that from 1988 to 1997 there were 6; from 1998 to 2007 there were 9; from 2008 to 2017 there were 24. Why does it appear that over the last 10 years our society is generating a sharp increase in skinwalkers, individuals committing murder and mayhem who have rejected all social bonds and attack people at their most vulnerable and unprepared? Perhaps it is because, as Sebastion Junger stated, this “shows how completely detribalized this country has become.” Our neurological genetic predisposition, the warrior ethos, all for 1 and 1 for all, is no longer relevant in modern life. As individuals in society it appears we are now very far from our evolutionary roots.
In 2013, areport from the Congressional Research Service, known as Congress's think tank, described mass shootings as those in which shooters "select victims somewhat indiscriminately" and kill four or more people.
From: http://timelines.latimes.com/deadliest-shooting-rampages/
Mass shootings over last 30 years until October 1, 2017. And recent news from October 2 to December 31, 2017.
November 14, 2017: Rampaging through a small Northern California town, a gunman took aim on Tuesday at people at an elementary school and several other locations, killing at least four and wounding at least 10 before he was fatally shot by police, the local sheriff’s office said.
November 5, 2017: Devin Patrick Kelley carried out the deadliest mass shooting in Texas history on Sunday, killing 25 people and an unborn child at First Baptist Church in Sutherland Springs, near San Antonio.
October 1, 2017: 58 killed, more than 500 injured: Las Vegas
More than 50 people were killed and at least 500 others injured when a gunman opened fire at a country music festival near the Mandalay Bay Resort and Casino on the Las Vegas Strip, authorities said. Police said the suspect, 64-year-old Stephen Paddock, a resident of Mesquite, Nev., was was found dead after a SWAT team burst into the hotel room from which he was firing at the crowd.
Jan. 6, 2017: 5 killed, 6 injured: Fort Lauderdale, Fla.
After taking a flight to Fort Lauderdale-Hollywood International Airport in Florida, a man retrieves a gun from his luggage in baggage claim, loads it and opens fire, killing five people near a baggage carousel and wounding six others. Dozens more are injured in the ensuing panic. Esteban Santiago, a 26-year-old Iraq war veteran from Anchorage, Alaska, has pleaded not guilty to 22 federal charges.
May 28, 2017: 8 killed, Lincoln County, Miss. A Mississippi man went on a shooting spree overnight, killing a sheriff's deputy and seven other people in three separate locations in rural Lincoln County before the suspect was taken into custody by police, authorities said on Sunday.
Sept. 23, 2016: 5 killed: Burlington, Wash.
A gunman enters the cosmetics area of a Macy’s store near Seattle and fatally shoots an employee and four shoppers at close range. Authorities say Arcan Cetin, a 20-year-old fast-food worker, used a semi-automatic Ruger .22 rifle that he stole from his stepfather’s closet.
June 12, 2016: 49 killed, 58 injured in Orlando nightclub shooting
The United States suffered one of the worst mass shootings in its modern history when 49 people were killed and 58 injured in Orlando, Fla., after a gunman stormed into a packed gay nightclub. The gunman was killed by a SWAT team after taking hostages at Pulse, a popular gay club. He was preliminarily identified as 29-year-old Omar Mateen.
Dec. 2, 2015: 14 killed, 22 injured: San Bernardino, Calif.
Two assailants killed 14 people and wounded 22 others in a shooting at the Inland Regional Center in San Bernardino. The two attackers, who were married, were killed in a gun battle with police. They were U.S.-born Syed Rizwan Farook and Pakistan national Tashfeen Malik, and had an arsenal of ammunition and pipe bombs in their Redlands home.
Nov. 29, 2015: 3 killed, 9 injured: Colorado Springs, Colo.
A gunman entered a Planned Parenthood clinic in Colorado Springs, Colo., and started firing.
Police named Robert Lewis Dear as the suspect in the attacks.
Oct. 1, 2015: 9 killed, 9 injured: Roseburg, Ore.
Christopher Sean Harper-Mercer shot and killed eight fellow students and a teacher at Umpqua Community College. Authorities described Harper-Mercer, who recently had moved to Oregon from Southern California, as a “hate-filled” individual with anti-religion and white supremacist leanings who had long struggled with mental health issues.
July 16, 2015: 5 killed, 3 injured: Chattanooga, Tenn. A gunman opened fire on two military centers more than seven miles apart, killing four Marines and a Navy sailor. A man identified by federal authorities as Mohammod Youssuf Abdulazeez, 24, sprayed dozens of bullets at a military recruiting center, then drove to a Navy-Marine training facility and opened fire again before he was killed.
June 18, 2015: 9 killed: Charleston, S.C.
Dylann Storm Roof is charged with nine counts of murder and three counts of attempted murder in an attack that killed nine people at a historic black church in Charleston, S.C. Authorities say Roof, a suspected white supremacist, started firing on a group gathered at Emanuel African Methodist Episcopal Church after first praying with them. He fled authorities before being arrested in North Carolina.
May 23, 2014: 6 killed, 7 injured: Isla Vista, Calif.
Elliot Rodger, 22, meticulously planned his deadly attack on the Isla Vista community for more than a year, spending thousands of dollars in order to arm and train himself to kill as many people as possible, according to a report released by the Santa Barbara County Sheriff’s Office. Rodger killed six people before shooting himself.
April 2, 2014: 3 killed; 16 injured: Ft. Hood, Texas
A gunman at Fort Hood, the scene of a deadly 2009 rampage, kills three people and injures 16 others, according to military officials. The gunman is dead at the scene.
Sept. 16, 2013: 12 killed, 3 injured: Washington, D.C. Aaron Alexis, a Navy contractor and former Navy enlisted man, shoots and kills 12 people and engages police in a running firefight through the sprawling Washington Navy Yard. He is shot and killed by authorities.
June 7, 2013: 5 killed: Santa Monica
John Zawahri, an unemployed 23-year-old, kills five people in an attack that starts at his father’s home and ends at Santa Monica College, where he is fatally shot by police in the school’s library.
Dec. 14, 2012: 27 killed, one injured: Newtown, Conn.
A gunman forces his way into Sandy Hook Elementary School in Newtown, Conn. and shoots and kills 20 first graders and six adults. The shooter, Adam Lanza, 20, kills himself at the scene. Lanza also killed his mother at the home they shared, prior to his shooting rampage.
Aug. 5, 2012: 6 killed, 3 injured: Oak Creek, Wis.
Wade Michael Page fatally shoots six people at a Sikh temple before he is shot by a police officer. Page, an Army veteran who was a “psychological operations specialist,” committed suicide after he was wounded. Page was a member of a white supremacist band called End Apathy and his views led federal officials to treat the shooting as an act of domestic terrorism.
July 20, 2012: 12 killed, 58 injured: Aurora, Colo.
James Holmes, 24, is taken into custody in the parking lot outside the Century 16 movie theater after a post-midnight attack in Aurora, Colo. Holmes allegedly entered the theater through an exit door about half an hour into the local premiere of “The Dark Knight Rises.”
April 2, 2012: 7 killed, 3 injured: Oakland
One L. Goh, 43, a former student at a Oikos University, a small Christian college, allegedly opens fire in the middle of a classroom leaving seven people dead and three wounded.
Jan. 8, 2011: 6 killed, 11 injured: Tucson, Ariz.
Jared Lee Loughner, 22, allegedly shoots Arizona Rep. Gabrielle Giffords in the head during a meet-and-greet with constituents at a Tucson supermarket. Six people are killed and 11 others wounded.
Nov. 5, 2009: 13 killed, 32 injured: Ft. Hood, Texas
Maj. Nidal Malik Hasan, an Army psychiatrist, allegedly shoots and kills 13 people and injures 32 others in a rampage at Ft. Hood, where he is based. Authorities allege that Hasan was exchanging emails with Muslim extremists including American-born radical Anwar Awlaki.
April 3, 2009: 13 killed, 4 injured: Binghamton, N.Y.
Jiverly Voong, 41, shoots and kills 13 people and seriously wounds four others before apparently committing suicide at the American Civic Assn., an immigration services center, in Binghamton, N.Y.
Feb. 14, 2008: 5 killed, 16 injured: Dekalb, Ill.
Steven Kazmierczak, dressed all in black, steps on stage in a lecture hall at Northern Illinois University and opens fire on a geology class. Five students are killed and 16 wounded before Kazmierczak kills himself on the lecture hall stage.
Dec. 5, 2007: 8 killed, 4 injured: Omaha
Robert Hawkins, 19, sprays an Omaha shopping mall with gunfire as holiday shoppers scatter in terror. He kills eight people and wounds four others before taking his own life. Authorities report he left several suicide notes.
April 16, 2007: 32 killed, 17 injured: Blacksburg, Va.
Seung-hui Cho, a 23-year-old Virginia Tech senior, opens fire on campus, killing 32 people in a dorm and an academic building in attacks more than two hours apart. Cho takes his life after the second incident.
Feb. 12, 2007: 5 killed, 4 injured: Salt Lake City
Sulejman Talovic, 18, wearing a trenchcoat and carrying a shotgun, sprays a popular Salt Lake City shopping mall. Witnesses say he displays no emotion while killing five people and wounding four others.
Oct. 2, 2006: 5 killed, 5 injured: Nickel Mines, Pa.
Charles Carl Roberts IV, a milk truck driver armed with a small arsenal, bursts into a one-room schoolhouse and kills five Amish girls. He kills himself as police storm the building.
July 8, 2003: 5 killed, 9 injured: Meridian, Miss.
Doug Williams, 48, a production assemblyman for 19 years at Lockheed Martin Aeronautics Co., goes on a rampage at the defense plant, fatally shooting five and wounding nine before taking his own life with a shotgun.
Dec. 26, 2000: 7 killed: Wakefield, Mass.
Michael McDermott, a 42-year-old software tester shoots and kills seven co-workers at the Internet consulting firm where he is employed. McDermott, who is arrested at the offices of Edgewater Technology Inc., apparently was enraged because his salary was about to be garnished to satisfy tax claims by the Internal Revenue Service. He uses three weapons in his attack.
Sept. 15, 1999: 7 killed, 7 injured: Fort Worth
Larry Gene Ashbrook opens fire inside the crowded chapel of the Wedgwood Baptist Church. Worshipers, thinking at first that it must be a prank, keep singing. But when they realize what is happening, they dive to the floor and scrunch under pews, terrified and silent as the gunfire continues. Seven people are killed before Ashbrook takes his own life.
April 20, 1999: 13 killed, 24 injured: Columbine, Colo.
Eric Harris and Dylan Klebold, students at Columbine High, open fire at the school, killing a dozen students and a teacher and causing injury to two dozen others before taking their own lives.
March 24, 1998: 5 killed, 10 injured: Jonesboro, Ark.
Middle school students Mitchell Johnson and Andrew Golden pull a fire alarm at their school in a small rural Arkansas community and then open fire on students and teachers using an arsenal they had stashed in the nearby woods. Four students and a teacher who tried shield the children are killed and 10 others are injured. Because of their ages, Mitchell. 13, and Andrew, 11, are sentenced to confinement in a juvenile facility until they turn 21.
Dec. 7, 1993: 6 killed, 19 injured: Garden City, N.Y.
Colin Ferguson shoots and kills six passengers and wounds 19 others on a Long Island Rail Road commuter train before being stopped by other riders. Ferguson is later sentenced to life in prison.
July 1, 1993: 8 killed, 6 injured: San Francisco
Gian Luigi Ferri, 55, kills eight people in an office building in San Francisco’s financial district. His rampage begins in the 34th-floor offices of Pettit & Martin, an international law firm, and ends in a stairwell between the 29th and 30th floors where he encounters police and shoots himself.
May 1, 1992: 4 killed, 10 injured: Olivehurst, Calif.
Eric Houston, a 20-year-old unemployed computer assembler, invades Lindhurst High School and opens fire, killing his former teacher Robert Brens and three students and wounding 10 others.
Oct. 16, 1991: 22 killed, 20 injured: Killeen, Texas
George Jo Hennard, 35, crashes his pickup truck into a Luby’s cafeteria crowded with lunchtime patrons and begins firing indiscriminately with a semiautomatic pistol, killing 22 people. Hennard is later found dead of a gunshot wound in a restaurant restroom.
June 18, 1990: 10 killed, 4 injured: Jacksonville, Fla.
James E. Pough, a 42-year-old day laborer apparently distraught over the repossession of his car, walks into the offices of General Motors Acceptance Corp. and opens fire, killing seven employees and one customer before fatally shooting himself.
Jan. 17, 1989: 5 killed, 29 injured: Stockton, Calif.
Patrick Edward Purdy turns a powerful assault rifle on a crowded school playground, killing five children and wounding 29 more. Purdy, who also killed himself, had been a student at the school from kindergarten through third grade.Police officials described Purdy as a troubled drifter in his mid-20s with a history of relatively minor brushes with the law. The midday attack lasted only minutes.
July 18, 1984: 21 killed, 19 injured: San Ysidro, Calif.
James Oliver Huberty, a 41-year-old out-of-work security guard, kills 21 employees and customers at a McDonald’s restaurant. Huberty is fatally shot by a police sniper perched on the roof of a nearby post office.
Synthisophy
Integrate the Wisdoms of History into Present Culture
Addressing the polarized political climate in the USA
Add Text Here...
.
Chapter 27
The Upside-Down Bell Curve
Looking at the blue line, the average human height is about 66 inches, with a range of the number taller and shorter than the average moving down and away from the average in both directions, making the shape of a bell. Note the red curve is a perfect bell curve and is the normal distribution. So the actual distribution of human height is quite close to the normal bell curve.
Let’s look at the distribution of political views in the US from the perspective of Left and Right as presented in Surveys conducted by the Pew Research Center. Particularly, let’s look at the Bell curves from 1994 to 2017 regarding the medians of Democratic and Republican views in the USA, as presented in Political Polarization, 1994-2017, Pew Research Center, October 20, 2017, except for text added in italic:


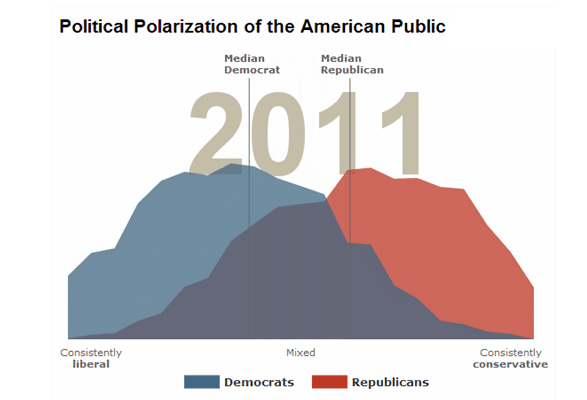

Democrat and Republican overlap. Overall it looks like a bell.
Democrat and Republican overlap. Overall it looks like a bell.
Democrat and Republican overlap. Overall it looks like a bell.
Are Democrats and Republicans starting to separate or is it still a bell?
Democrats and Republicans are separating
Democrats and Republicans have significantly separated, there are now two peaks and it no longer looks like a bell.
The following information is from The Partisan Divide on Political Values Grows Even Wider, Pew Research Center, October 5, 2017, except for informaton in italic.
Partisan divides over political values widen
The gap between the political values of Democrats and Republicans is now larger than at any point in Pew Research Center surveys dating back to 1994, a continuation of a steep increase in the ideological divisions between the two parties over more than a decade.
The subsequent chapters explore Americans’ attitudes across individual political values and policy issues, in most cases including data dating back to the late 1990s or early 2000s. In nearly every domain, across most of the roughly two dozen values questions tracked, views of Republicans and Republican-leaning independents and those of Democrats and Democratic leaners are now further apart than in the past.
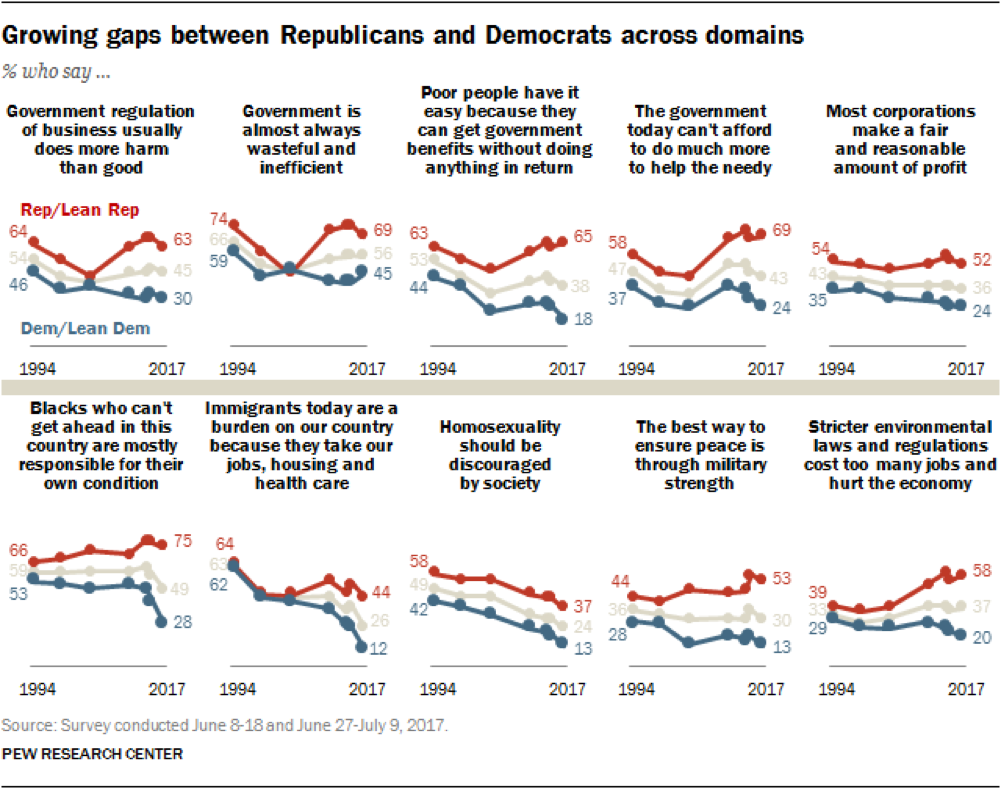
While the overall partisan gap across a variety of political values has steadily grown, the dynamic underlying the growing gap differs across issue areas. In some cases, the gap has grown because the parties have moved in different directions, with growing shares of Democrats taking liberal positions and increasing shares of Republicans taking conservative positions. But in other areas, shifts are greater among one set of partisans than another.
In a few issue areas, notably views of homosexuality and of immigrants, public opinion in both parties has clearly shifted in a more liberal direction over the past several decades. Nevertheless, the partisan gaps on both of these values have gotten wider over the past two decades, as the long-term shifts are more pronounced among Democrats than Republicans.
Overall partisan gap widens over two decades
Note the gap starts to widen between 1999 and 2004, which is the time, the year 2000, that Andersen claimed as the first unequivocal year of Fantasyland.

The 10 political values questions (shown at the bottom of this page) have been asked together in surveys seven times since 1994. On average, there is now a 36-percentage-point difference between Democrats and Republicans across these questions. The current gap represents a modest increase in the partisan divide over the past two years (from 33 points in 2015), but it is substantially wider than two decades ago (the gap was just 15 points in 1994).
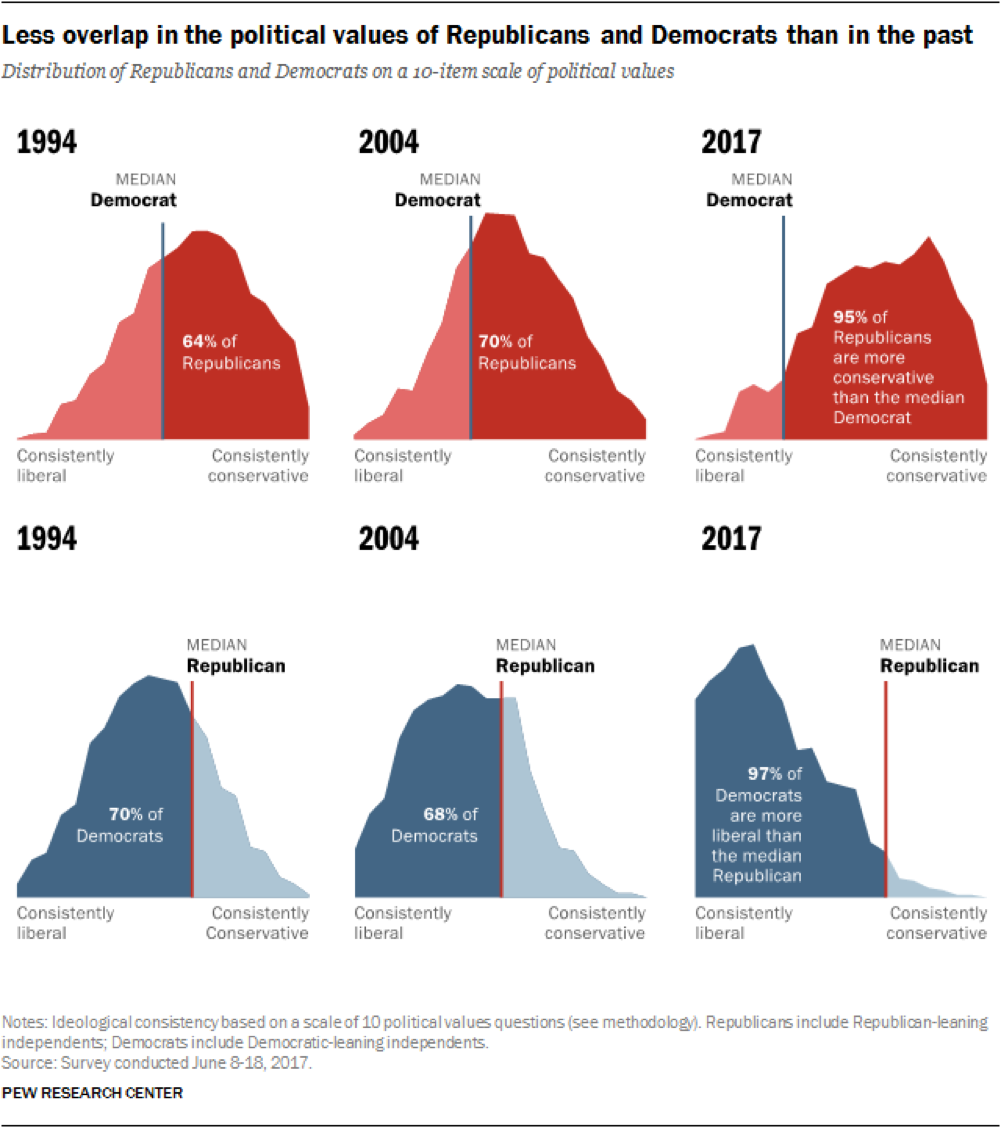
For instance, overall, on this scale of 10 political values, the median (middle) Republican is now more conservative than 97% of Democrats, and the median Democrat is more liberal than 95% of Republicans. By comparison, in 1994 there was substantially more overlap between the two partisan groups than there is today: Just 64% of Republicans were to the right of the median Democrat, while 70% of Democrats were to the left of the median Republican. Put differently, in 1994 23% of Republicans were more liberal than the median Democrat; while 17% of Democrats were more conservative than the median Republican. Today, those numbers are just 1% and 3%, respectively.
Partisan Animosity
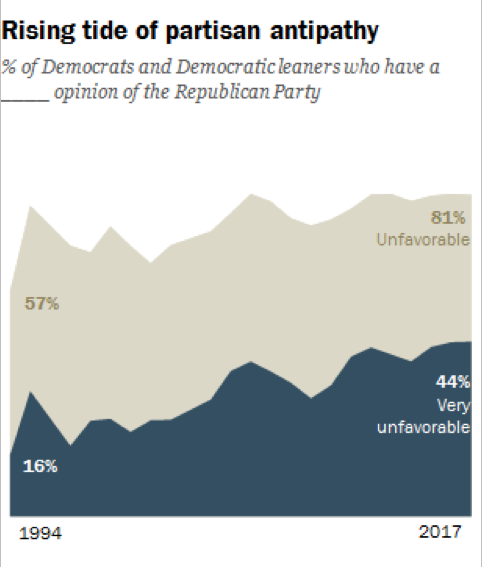

As Republicans and Democrats have moved further apart on political values and issues, there has been an accompanying increase in the level of negative sentiment that they direct toward the opposing party. Partisans have long held unfavorable views of the other party, but negative opinions are now more widely held and intensely felt than in the past.
Among members of both parties, the shares with very unfavorable opinions of the other party have more than doubled since 1994.
More negative views of the opposing party – and its members
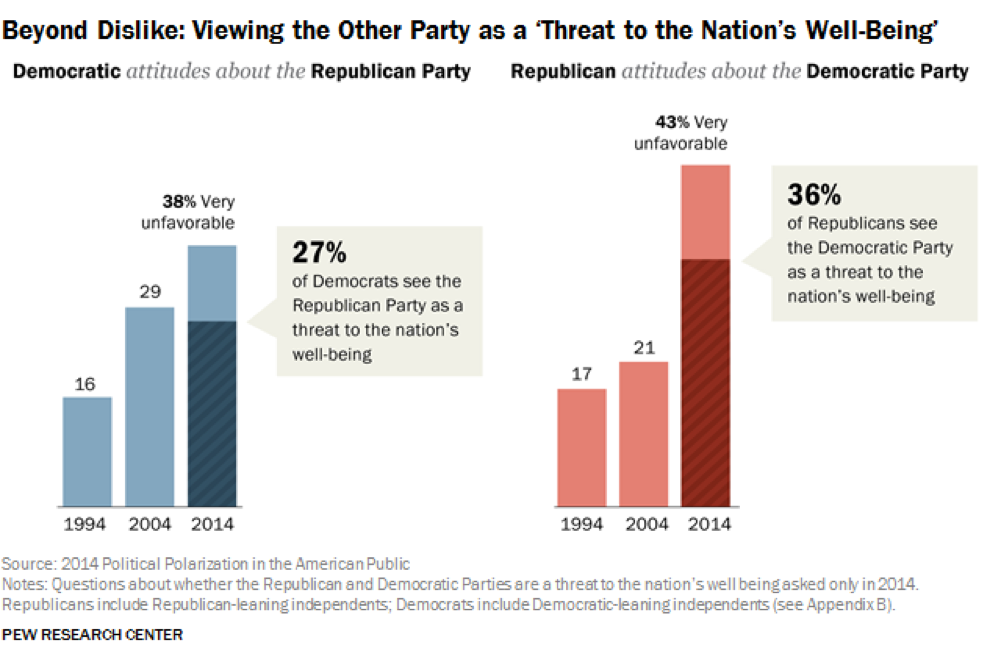
As noted in the Center’s 2014 study of political polarization, Republicans and Democrats have long had negative opinions of the other party. But in the past, more partisans had mostly unfavorable views than very unfavorable views.
This is no longer the case. About eight-in-ten Democrats and Democratic-leaning independents (81%) have an unfavorable opinion of the Republican Party, based on an average of surveys conducted this year – with 44% expressing a very unfavorable view. Two decades ago, a smaller majority of Democrats (57%) viewed the GOP unfavorably, and just 16% held a very unfavorable view.
The share of Republicans with highly negative opinions of the Democratic Party has followed a similar trajectory. Currently, 81% of Republicans and Republican leaners have an unfavorable impression of the Democratic Party, with 45% taking a very unfavorable view. In 1994, 68% of Republicans had a negative view of the Democratic Party; just 17% had a very unfavorable opinion.
Let’s compare the Left and Right ideological curves over the last 25 years
Information below is from: Political Polarization in the American Public, Pew Research Center, June 12, 2014
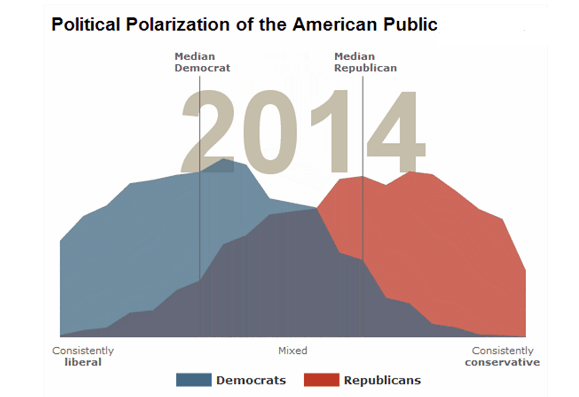
The graphic below shows the extent to which members of both parties have become more ideologically consistent and, as a result, further from one another. When responses to 10 questions are scaled together to create a measure of ideological consistency, the median (middle) Republican here is more conservative than nearly all Democrats (94%), and the median Democrat is more liberal than 92% of Republicans.


As can be seen above, in the 2014 political environment, party (and partisan leaning) predicts ideological consistency more than ever before, and this is particularly the case among the politically engaged. Among Americans who kept up with politics and government and who regularly vote, fully 99% of Republicans were more conservative than the median Democrat, while 98% of Democrats were more liberal than the median Republican. While engaged partisans have always been ideologically divided, there was more overlap in the recent past; just 10 years ago these numbers were 88% and 84%, respectively. Here we see the start of significant polarization.
Another PEW Survey was done in 2017:
Here is a graph of the politically engaged in 2017. Here the upside down bell curve becomes prominent.
From: Political Polarization, 1994-2017, Pew Research Center, October 20, 2017.
Note in 1994 there is no split in the curve between the Left and the Right, in 2004 we can see a split starting, by 2014 we can see an increase in polarization as the upside-down bell curve shows itself, and by 2017 the upside-down bell curve becomes prominent. This shows us the polarization of the Left and Right and the upside-down bell curve now present in the USA. If a bell curve is considered normal, why do we as a society among the politically active and influential have an upside-down bell curve, is that abnormal? Why are we so polarized? The answer lies in the human brain and neurological evolution. It’s in our genes, it’s been in our genes for a very long time: cognitive bias probably developing over the course of late mammalian evolution and present in Australopithecus; to confirmation bias in Homo habilis; to the tribe and argumentative theory, where truth doesn’t matter, winning the argument and gaining power does in Homo erectus; all the while generating the tribal ethos resulting in the warrior ethos that lead Homo sapiens out of Africa 70,000 years ago to dominate the world. Our genetically evolved and present cognitive, confirmation, tribal and argumentative biases shape our polarized perceptions of the world around us, and our warrior ethos finds others of similar mind to battle the opposing party. Do we have to be this polarized? Can individual human consciousness be aware of this predisposition and keep it in check, putting value in moderation, reason and truth? Can your neuroreality be neureal and rather than unneural? Ben Franklin addressed that question after the Constitutional Convention: “We’ve given you a republic, can you keep it?” Perhaps if we depolarize, get back to the normal bell curve, become more neureal, and become more centrist as a Nation, the answer will be yes.
Here’s another example of the upside-down bell curve regarding the political activism gap with regard to political donation, again from Political Polarization in the American Public, Pew Research Center, June 12, 2014, see the graph below:

Many of those in the center remain on the edges of the political playing field ... while the most ideologically oriented and politically rancorous Americans make their voices heard.
The rise of ideological uniformity has been much more pronounced among those who are the most politically active. Today, almost four-in-ten (38%) politically engaged Democrats are consistent liberals, up from just 8% in 1994. The change among Republicans since then appears less dramatic – 33% express consistently conservative views, up from 23% in the midst of the 1994 “Republican Revolution.” But a decade ago, just 10% of politically engaged Republicans had across-the-board conservative attitudes
On measure after measure – whether primary voting, writing letters to officials, volunteering for or donating to a campaign – the most politically polarized are more actively involved in politics, amplifying the voices that are the least willing to see the parties meet each other halfway.
These are among the findings of the largest study of U.S. political attitudes ever undertaken by the Pew Research Center. Data are drawn from a national telephone survey of 10,013 adults, conducted from January through March of this year, and an ongoing series of follow-up surveys. This rich dataset, coupled with trends and insights from two decades of Pew Research Center polling, reveals a complex picture of partisan polarization and how it manifests itself in political behaviors, policy debates, election dynamics and everyday life.
Where are you on the political spectrum? Take the Ideology Consistency Scale Test below that was used in these surveys. I came out with a -1.
Throughout this report we utilize a scale composed of 10 questions asked on Pew Research Center surveys going back to 1994 to gauge the extent to which people offer mostly liberal or mostly conservative views across a range of political value dimensions. In short, while there is no ex-ante reason for people’s views on diverse issues such as the social safety net, homosexuality and military strength to correlate, these views have a traditional “left/right” association, and the scale measures this growing correlation over time.
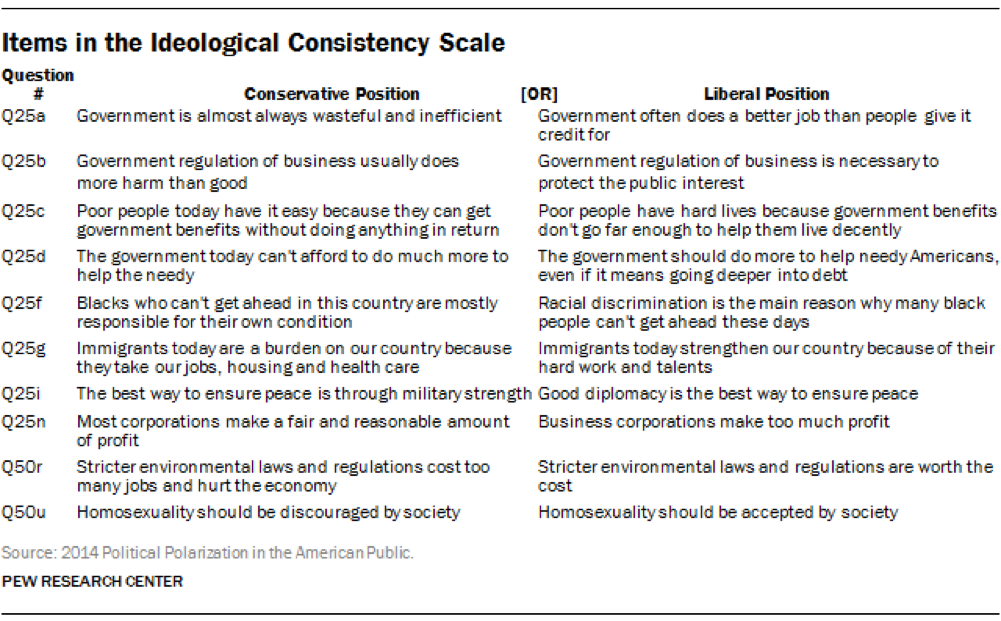
The individual questions in the scale are shown above.
Individual questions were recoded as follows: “-1” for a liberal response, “+1” for a conservative response, “0” for other (don’t know / didn't answer, etc...) responses. As a result, scores on the full scale range from -10 (liberal /left responses to all 10 questions) to +10 (conservative/right responses to all 10 questions). For analytical purposes, respondents are grouped into one of five categories, which are used throughout the report, as follows:
- Consistently conservative (+7 to +10), aka Far Right
- Mostly conservative (+3 to +6), aka Moderte Right
- Mixed (-2 to +2), aka Cenrtist
- Mostly liberal (-6 to -3), aka Moderate Left
- Consistently liberal (-10 to -7), aka Far Left
To put these figures in perspective, a respondent offering five liberal and five conservative views, or six of one and four of the other, would be considered a Centrist. Someone offering seven conservative and three liberal responses, or eight and two, would be considered “Moderate Right.” And any respondents offering nine conservative and one liberal response, or all ten conservative, would be considered “Far Right.” Since some people do not answer every question, other combinations are possible.


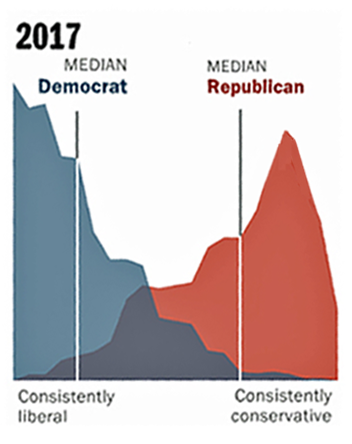
Let’s look at the progression of the politically engaged graphs over the past 25 years, bold added for emphasis.
The regular bell curve refers to a normal distribution of a value across a range. Let’s look at the distribution of human height:
Video Summary
11 minute video
11 minute read
